Cluster · Pie Chart Data Interpretation
| Question | Category | Subtype | Difficulty | ||||||||||||||||||||||||||||||||||||||||
|---|---|---|---|---|---|---|---|---|---|---|---|---|---|---|---|---|---|---|---|---|---|---|---|---|---|---|---|---|---|---|---|---|---|---|---|---|---|---|---|---|---|---|---|
|
The following pie chart shows the annual expenditure on different items. What is the minimum angle in the given pie chart?
pipeline-1068730
|
ssc | — | intermediate | ||||||||||||||||||||||||||||||||||||||||
|
Find the expenditure (in Rs.) on education. pipeline-1068780
|
ssc | — | intermediate | ||||||||||||||||||||||||||||||||||||||||
|
Find the central angle for the book in store S. pipeline-1066488
|
ssc | — | intermediate | ||||||||||||||||||||||||||||||||||||||||
|
What is the average business (in crore rupees) of movies with lowest and highest businesses? pipeline-1042113
|
ssc | — | intermediate | ||||||||||||||||||||||||||||||||||||||||
|
The pie-chart given here shows the spending of a country on various sports during a year. Study the graph carefully to answer these questions.
pipeline-1039457
|
ssc | — | intermediate | ||||||||||||||||||||||||||||||||||||||||
|
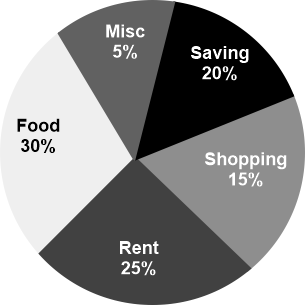
How much percent is more expense on rent than the expense on others? pipeline-1066438
|
ssc | percentage | intermediate | ||||||||||||||||||||||||||||||||||||||||
|
Find the difference between the amount spent on beauty products and cosmetic products. pipeline-1039344
|
ssc | — | intermediate | ||||||||||||||||||||||||||||||||||||||||
|
The following pie-chart shows the percentage distribution of the expenditure on various items.
If the savings of a person is Rs 6500, find the expenditure on rent. pipeline-1038534
|
ssc | percentage | intermediate | ||||||||||||||||||||||||||||||||||||||||
|
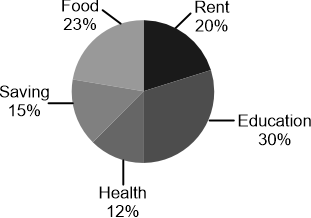
The pie chart given below shows the monthly expenditure of a family (in rupees) on various items.If the total earning is ₹70,560, then find the difference between the amount spent on Education and Rent.
pipeline-1175925
|
ssc | — | intermediate | ||||||||||||||||||||||||||||||||||||||||
|
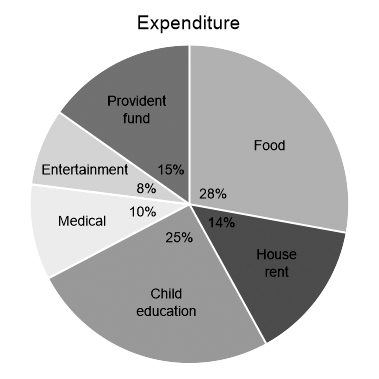
What is the approximate percentage of expenditure incurred on education with respect to the expenditure on rent? pipeline-1168486
|
ssc | percentage | intermediate | ||||||||||||||||||||||||||||||||||||||||
|
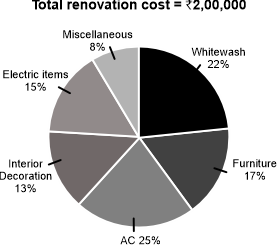
Study the given pie chart and answer the question that follows. Ravi decides to renovate his old house. His percentage expenditure on different renovating items is given by the pie chart.
Ravi gets a discount of 10% and 8% on the cash payment for Furniture and Electric items, respectively. What is the total amount (in ₹) paid by him for furniture and Electric items? pipeline-1168494
|
ssc | — | intermediate | ||||||||||||||||||||||||||||||||||||||||
|
The following pie chart shows the spending of a country on tourism in various districts during a particular year. Total spending of the country = ₹ 15,62,000. Study the pie chart and answer the following question.
How much less money (in ₹) is spent on District C than on District E? pipeline-1130245
|
ssc | — | intermediate | ||||||||||||||||||||||||||||||||||||||||
|
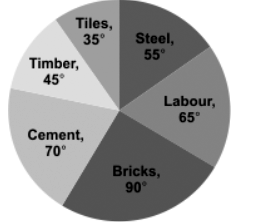
Study the given pie-chart and answer the question that follows. The pie-chart shows total expenditure of ₹ 3,00,00,000 on different items for constructinga flat in a town.
The percentage of the total expenditure on labour and timber is: pipeline-1088128
|
ssc | percentage | intermediate | ||||||||||||||||||||||||||||||||||||||||
|
Find the expenditure (in Rs.) on education. pipeline-1066487
|
ssc | — | intermediate | ||||||||||||||||||||||||||||||||||||||||
|
The following pie chart shows the annual expenditure on different items. What is the minimum angle in the given pie chart?
pipeline-1056180
|
ssc | — | intermediate | ||||||||||||||||||||||||||||||||||||||||
|
Find the difference between the amount spent on beauty products and cosmetic products. pipeline-1054697
|
ssc | — | intermediate | ||||||||||||||||||||||||||||||||||||||||
|
The pie chart shows the cost of construction of a house in degree.
What is the average expenditure on timber, super-vision, and cement? pipeline-1042480
|
ssc | — | intermediate | ||||||||||||||||||||||||||||||||||||||||
|
If the total income of Mr. X is Rs 1,20,000, then how much does he pay for transport? pipeline-1368976
|
ssc | — | intermediate | ||||||||||||||||||||||||||||||||||||||||
|
The given pie-chart represents the survey report on the favourite games of a group of young people.
If a total of 4980 people were surveyed, then what is the central angle produced by the sector indicating football? pipeline-1188924
|
ssc | — | intermediate | ||||||||||||||||||||||||||||||||||||||||
|
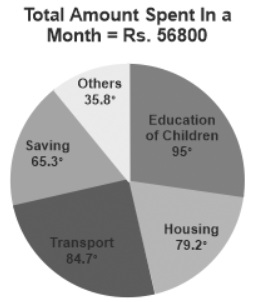
Study the given pie chart carefully and answer the question that follows. Degree-wise Break-up of Expenditure of a Family in a Month
What is the amount spent by the family on housing? pipeline-1168591
|
ssc | — | intermediate | ||||||||||||||||||||||||||||||||||||||||
|
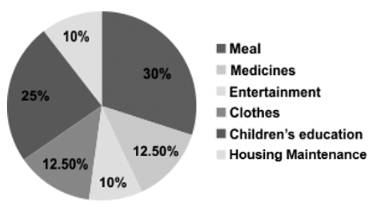
The pie chart given below shows the monthly expenditures made by a family under different heads as percentages of the total income of the family if the total monthly income of the family is Rs 70,000, then what is the amount that is left with the family after only the food and medical expenditures for the month are made?
pipeline-1144207
|
ssc | — | intermediate | ||||||||||||||||||||||||||||||||||||||||
|
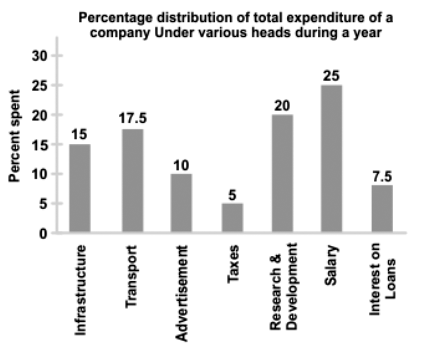
Study the given graph and answer the question that follows.
The expenditure on Interest on Loans is by what percentage more than the expenditure on Taxes? pipeline-1130223
|
ssc | percentage | intermediate | ||||||||||||||||||||||||||||||||||||||||
|
Study the given pie chart and answer the question that follows. The pie chart represents the percentage of magazine users in five different cities of India.
What is the central angle made by Bhopal city in the pie chart? pipeline-1042455
|
ssc | percentage | intermediate | ||||||||||||||||||||||||||||||||||||||||
|
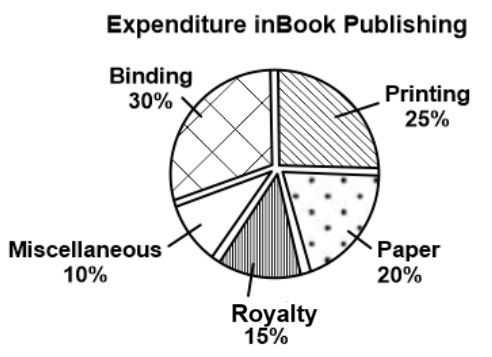
Study the given pie-chart and answer the question that follows.The pie-chart shows the expenditure incurred in the preparation of a book by a publisher, under various heads.
What is the difference between the angle of the pie chart showing the expenditure incurred on binding and printing? pipeline-1036007
|
ssc | — | intermediate | ||||||||||||||||||||||||||||||||||||||||
The ratio of total salary and total expenditure per year from 2001 to 2006 is pipeline-1026806
|
ssc | — | intermediate | ||||||||||||||||||||||||||||||||||||||||