Cluster · Pie Chart Data Interpretation
| Question | Category | Subtype | Difficulty | |||||||||||||||||||
|---|---|---|---|---|---|---|---|---|---|---|---|---|---|---|---|---|---|---|---|---|---|---|
|
What is the average expenditure on all pets combined in 2024? pipeline-1046031
|
banking | — | intermediate | |||||||||||||||||||
|
Total expenditure on Rabbit is what percentage of total expenditure on Dog? (Approx.) pipeline-1046030
|
banking | percentage | intermediate | |||||||||||||||||||
|
If the 1st and 4th quarters are considered as winters and the other 2 quarters as summers, what is the difference in total expenditure on all pets between winters and summers? pipeline-1046032
|
banking | — | intermediate | |||||||||||||||||||
|
What is the ratio of expenditure on cat in the first quarter and third quarter to expenditure on dog in the second and fourth quarters? pipeline-1046033
|
banking | — | intermediate | |||||||||||||||||||
|
What is the difference in the expenditure between the quarter in which he spent maximum and the quarter in which he spent minimum? pipeline-1046034
|
banking | — | intermediate | |||||||||||||||||||
|
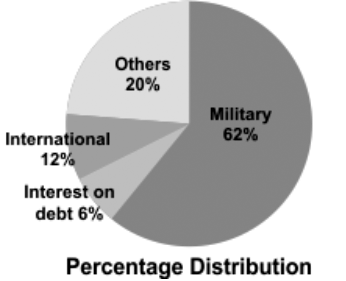
Study the given pie-chart and answer the question that follows. The pie-chart shows the National Budget Expenditure in the year 2024.
If ₹850 billion were spent in year 2024 for interest on debt and military, then what would have been the total expenditure for that year (in ₹ billion)? pipeline-1318979
|
defence | — | intermediate | |||||||||||||||||||
|
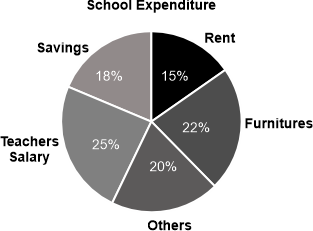
The following pie chart shows the percentage distribution of school expenditure.
If the teacher's salary and rent together is ₹45 lakhs, then find the savings.
pipeline-1296664
|
defence | percentage | intermediate | |||||||||||||||||||
|
Expenses (in multiples of ₹10,000/-) on consumption of fuel for the official car at a regional office (RO) of a national organization during 2006-2010 are given below in a tabular form along with the National Averages (NA) during the said period. It is given that there are five ROS.
If the data of the RO is represented through a pie chart, then what would be the central angle (nearest to a degree) of the sector corresponding to the year 2008? pipeline-1290127
|
defence | — | intermediate | |||||||||||||||||||
|
If the total income of the family was Rs 1,00,000, how much money (in Rs) was spent on the education of the children? pipeline-1241993
|
defence | — | intermediate | |||||||||||||||||||
|
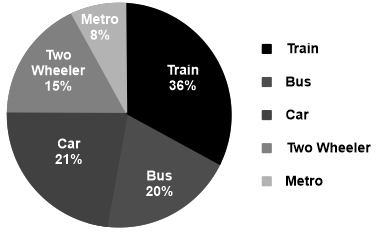
Pie-chart represent the modes of transport used by different employees in a university.
The central angle of the sector for officers using two-wheelers is: pipeline-1242018
|
defence | — | intermediate | |||||||||||||||||||
|
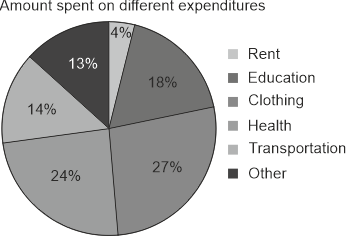
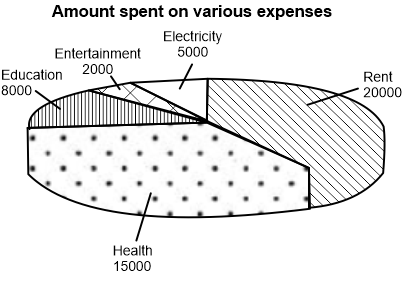
The following figure shows the expenditures incurred by Rohan in different heads. Rohan has a monthly income of ₹ 50,000, out of which he spends 60% on different expenditures. What is the total expenditure (in ₹) incurred on Health, Education, and Transportation together?
pipeline-1259351
|
ib | — | intermediate | |||||||||||||||||||
|
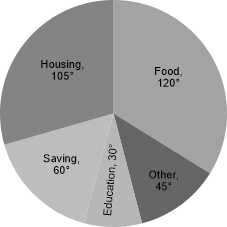
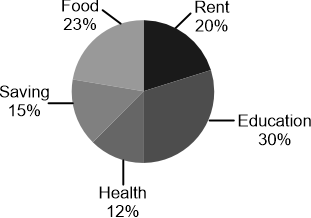
A family saves 30% of the total income and the savings amount to ₹600 less than half of the expenditure. If the total expenditure is spent on health, food, and education in the ratio of 3 : 5 : 6, then what amount of expenditure is spent on education? pipeline-1227928
|
ib | — | intermediate | |||||||||||||||||||
|
The pie chart given here shows expenditures incurred by a family on various items and their savings, which amount to Rs. 8,000 in a month. Study the chart and answer the question based on the pie chart.
The ratio of the expenditure on food to the savings is: pipeline-1106753
|
delhi_police | — | intermediate | |||||||||||||||||||
|
Find the expenditure (in Rs.) on education. pipeline-1200831
|
delhi_police | — | intermediate | |||||||||||||||||||
|
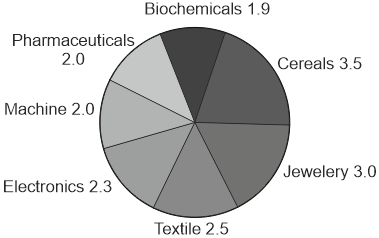
The following pie chart shows the spending of a country ( ₹ in crores) on the import of various products during a particular year. Based on the circle graph answer the question given below.
If the amount spent on importing only cereals during the year was ₹5 crores, then what was total approximate amount spent on importing all the various products in that year? pipeline-1086501
|
delhi_police | — | intermediate | |||||||||||||||||||
|
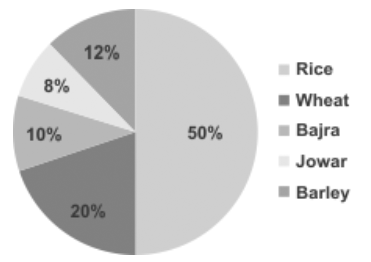
The given pie chart shows the distribution of land under various food crops. The expenditure invested on these food crops is ₹25,000 per annum. Study the pie chart carefully and answer the question that follows.
The expenditure invested in Rice and Barley is what percentage (correct to 2 decimal places) of the expenditure invested in Wheat and Bajra? pipeline-1133095
|
delhi_police | percentage | intermediate | |||||||||||||||||||
|
The earning (in crore Rs) of which firm was highest in the year 2015? pipeline-1094398
|
delhi_police | — | intermediate | |||||||||||||||||||
|
The given pie chart illustrates the various sources of funding (in ₹ crores)that the Public Works Department (PWD) plans to collect for its Phase II Projects.
To support the project with ₹4910 crores through toll collection by an outsourced agency, allowing for a maximum 20% commission, what is the total amount that the outsourced agency should be permitted to collect? pipeline-1199192
|
delhi_police | — | intermediate | |||||||||||||||||||
|
The pie chart given below shows the monthly expenditure of a family (in rupees) on various items.If the total earning is ₹70,560, then find the difference between the amount spent on Education and Rent.
pipeline-1200736
|
delhi_police | — | intermediate | |||||||||||||||||||
|
The following pie-chart shows the percentage distribution of the expenditure on various items.
If the savings of a person is Rs 6500, find the expenditure on rent. pipeline-835838
|
railways | percentage | intermediate | |||||||||||||||||||
|
Find the difference between the amount spent on beauty products and cosmetic products. pipeline-802180
|
railways | — | intermediate | |||||||||||||||||||
|
A family income is ₹35,000 in a month. The family spends the income on various expenditures, viz., food, health, education, entertainment, and rent. After incurring all the expenditures, 8% is saved every month. The expenditure on health is 50% more than that of food. While food is three times of the expenditure on entertainment, the expenditure on health is half of the expenditure on education. The expenditure on rent is one-third of the combined expenditure on food, health and education. How much expenditure (in ₹) is incurred on education? pipeline-1134099
|
railways | — | intermediate | |||||||||||||||||||
|
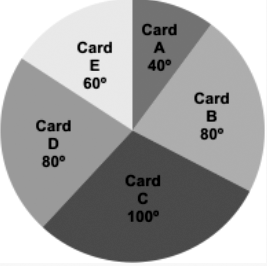
The pie chart shows the money spent by Aditya through credit cards of different banks. The total money spent by him through credit cards in a year is Rs. 3,60,000.
How much more money was spent through Card C as compared to Card D? pipeline-1106605
|
railways | — | intermediate | |||||||||||||||||||
|
What is the approximate percentage of expenditure incurred on education with respect to the expenditure on rent? pipeline-1106618
|
railways | percentage | intermediate | |||||||||||||||||||
|
Find the expenditure (in Rs.) on education. pipeline-1081192
|
railways | — | intermediate | |||||||||||||||||||
|
The following pie-chart shows the percentage distribution of the expenditure on various items.
If the savings of a person is Rs 6500, find the expenditure on rent. pipeline-1055635
|
railways | percentage | intermediate | |||||||||||||||||||
|
What is the ratio of total monthly income of B and E together and the total amount spent on Food and Miscellaneous together? pipeline-848773
|
railways | — | intermediate | |||||||||||||||||||
|
If the fund collected from Russia gets doubled then, it is how much less than the half fund of India (in lakhs)? pipeline-1023150
|
railways | — | intermediate | |||||||||||||||||||
|
Find the difference between the amount spent on beauty products and cosmetic products. pipeline-827047
|
railways | — | intermediate | |||||||||||||||||||
|
If the total income of the family was Rs 1,00,000, how much money (in Rs) was spent on the education of the children? pipeline-1291730
|
railways | — | intermediate | |||||||||||||||||||
|
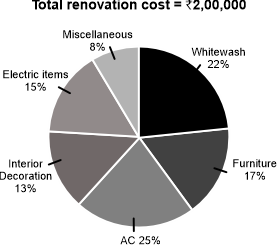
Study the given pie chart and answer the question that follows. Ravi decides to renovate his old house. His percentage expenditure on different renovating items is given by the pie chart.
Ravi gets a discount of 10% and 8% on the cash payment for Furniture and Electric items, respectively. What is the total amount (in ₹) paid by him for furniture and Electric items? pipeline-1273212
|
railways | — | intermediate | |||||||||||||||||||
|
The given pie chart illustrates the various sources of funding (in ₹ crores)that the Public Works Department (PWD) plans to collect for its Phase II Projects.
To support the project with ₹4910 crores through toll collection by an outsourced agency, allowing for a maximum 20% commission, what is the total amount that the outsourced agency should be permitted to collect? pipeline-1272217
|
railways | — | intermediate | |||||||||||||||||||
|
The pie chart shows the cost of construction of a house in degree.
What is the average expenditure on timber, super-vision, and cement? pipeline-1201466
|
ssc | — | intermediate | |||||||||||||||||||
|
The given pie chart illustrates the various sources of funding (in ₹ crores)that the Public Works Department (PWD) plans to collect for its Phase II Projects.
To support the project with ₹4910 crores through toll collection by an outsourced agency, allowing for a maximum 20% commission, what is the total amount that the outsourced agency should be permitted to collect? pipeline-1163961
|
ssc | — | intermediate | |||||||||||||||||||
|
What is the ratio of total tax paid by companies B and D together and that by companies A and E together? pipeline-1111476
|
ssc | — | intermediate | |||||||||||||||||||
|
The following table shows the monthly expenses (in Rs) of three persons.
What is the total expenses of all three persons on Food (in Rs)? pipeline-1133185
|
ssc | — | intermediate | |||||||||||||||||||
|
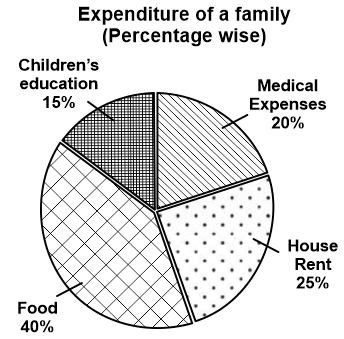
The following pie chart shows the various expenses of a family, as percentages of total expenditure of the family during a period.
If the total expenditure of the family during that period was Rs 2,00,000 then find the amount spent on medical expenses (in Rs). pipeline-1133179
|
ssc | — | intermediate | |||||||||||||||||||
|
Study the given pie chart carefully and answer the following question. What is the difference between the funds (in Rs.) acquired by the school from donations and those from government agencies?
pipeline-1043288
|
ssc | — | intermediate | |||||||||||||||||||
|
If the fund collected from Russia gets doubled then, it is how much less than the half fund of India (in lakhs)? pipeline-1067066
|
ssc | — | intermediate | |||||||||||||||||||
|
Find the difference between the amount spent on beauty products and cosmetic products. pipeline-1067065
|
ssc | — | intermediate | |||||||||||||||||||
|
What is the central angle corresponding to the sector indicating the expenses incurred on Health?
pipeline-1055740
|
ssc | — | intermediate | |||||||||||||||||||
|
If the fund collected from Russia gets doubled then, it is how much less than the half fund of India (in lakhs)? pipeline-718508
|
ssc | — | intermediate | |||||||||||||||||||
|
The given pie chart illustrates the various sources of funding (in ₹ crores)that the Public Works Department (PWD) plans to collect for its Phase II Projects.
To support the project with ₹4910 crores through toll collection by an outsourced agency, allowing for a maximum 20% commission, what is the total amount that the outsourced agency should be permitted to collect? pipeline-1168761
|
ssc | — | intermediate | |||||||||||||||||||
|
The pie chart shows the money spent by Aditya through credit cards of different banks. The total money spent by him through credit cards in a year is Rs. 3,60,000.
How much more money was spent through Card C as compared to Card D? pipeline-1193398
|
ssc | — | intermediate | |||||||||||||||||||
|
Pie-chart represent the modes of transport used by different employees in a university.
The central angle of the sector for officers using two-wheelers is: pipeline-1154017
|
ssc | — | intermediate | |||||||||||||||||||
|
If the total income of the family was Rs 1,00,000, how much money (in Rs) was spent on the education of the children? pipeline-1154018
|
ssc | — | intermediate | |||||||||||||||||||
|
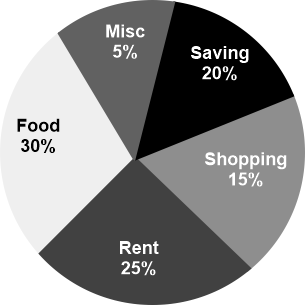
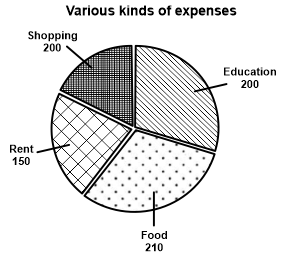
The following pie chart gives the ratio of various kinds of expenses of a particular family for a week.
If the amount spent on shopping for the week is Rs 1,000, what is the total amount spent on food (in Rs)? pipeline-1130273
|
ssc | — | intermediate | |||||||||||||||||||
|
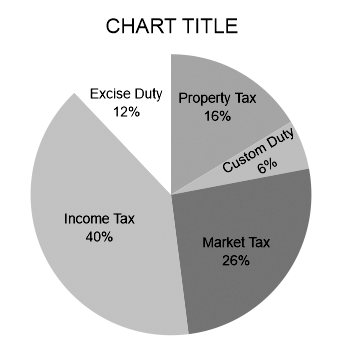
The following pie chart shows the distribution of income from different taxes. Study the chart and answer the question.
If the income from the market tax in a year is Rs. 260 crore, then the total income from other sources is : (in crore) pipeline-1130445
|
ssc | — | intermediate | |||||||||||||||||||
|
How much does he spend on children's fees in a year (in Rs)? pipeline-1130284
|
ssc | — | intermediate | |||||||||||||||||||
|
The monthly budget of an average household is given in the following table.
How much the percentage of the monthly budget spent on clothing is:
pipeline-1085149
|
ssc | percentage | intermediate |