Cluster · Data Interpretation and Graph Analysis
| Question | Category | Subtype | Difficulty | ||||||||||||||||||||||
|---|---|---|---|---|---|---|---|---|---|---|---|---|---|---|---|---|---|---|---|---|---|---|---|---|---|
|
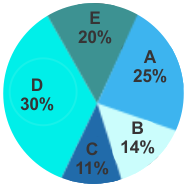
The following pie-chart shows the percentage quantity of wheat produced by five companies.
How many companies will produce the quantity of wheat more than the quantity produced by B & C together? pipeline-1139547
|
up_police | percentage | intermediate | ||||||||||||||||||||||
|
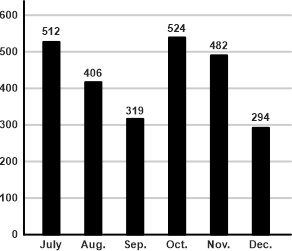
What is the average number of peoples celebrating their birthdays in different months? pipeline-1139550
|
up_police | — | intermediate | ||||||||||||||||||||||
|
How many cars assembled by machine C were accepted? pipeline-1170529
|
up_police | — | intermediate | ||||||||||||||||||||||
|
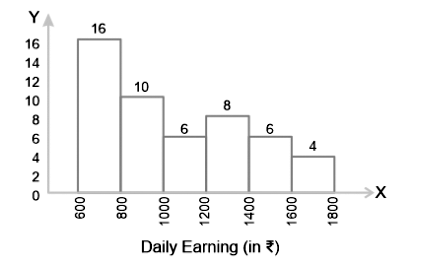
The following histogram represents the daily earnings of 50 medical stores in the locality.
The difference between the percentage of medical stores whose daily earnings are less than 1,000 and the percentage of medical stores whose daily earnings are 1,200 and above is: pipeline-1170690
|
up_police | percentage | intermediate | ||||||||||||||||||||||
|
Which year shows the highest change in the revenue obtained from magazines? pipeline-1170193
|
up_police | — | intermediate | ||||||||||||||||||||||
|
Directions: Study the following graph carefully and answer the questions given below it. The graph shows the sales of Sanitizers (in thousands) over the months.
How many Sanitizers (in thousands) were sold during the months under survey? pipeline-1158156
|
up_police | — | intermediate | ||||||||||||||||||||||
|
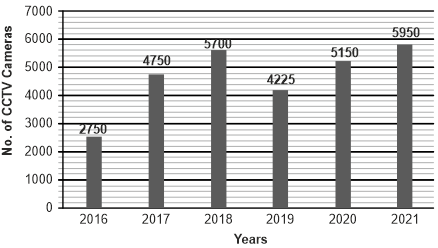
The following bar graph represents the number of CCTV cameras manufactured by a company over six years, study the graph carefully and answer the question that follows.
What is the ratio of the total number of CCTVs cameras manufactured by the company in the year of 2016-17 to the total number of CCTV cameras manufactured in the year of 2020-21? pipeline-1170027
|
up_police | — | intermediate | ||||||||||||||||||||||
|
In which month was the sale of Melons the lowest and by how much was it more than the sale of Oranges in that month? pipeline-1170353
|
up_police | — | intermediate | ||||||||||||||||||||||
|
Directions : Study the following graph carefully and answer the questions given below it. The graph shows the sales of Sanitizers (in thousands) over the months.
The sanitizers sold in the month of August are approximately what percent of that sold in the month of July? pipeline-1158133
|
up_police | percentage | intermediate | ||||||||||||||||||||||
|
The table given below shows production of car by two companies J and K in 5 years.
L1 = The total production of car by J in all years. L2 = The total production of car by K in all years. What is the value of (L2 - L1)? pipeline-1157366
|
up_police | — | intermediate | ||||||||||||||||||||||
|
What percentage of masks produced by B is more than those produced by C in the year 2021? pipeline-1146046
|
up_police | percentage | intermediate | ||||||||||||||||||||||
|
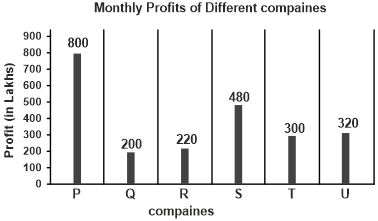
The following bar graph shows the monthly profits of different six compaines.
What is the ratio of the monthly profit of compaines P to that of company U? pipeline-1141836
|
up_police | — | intermediate | ||||||||||||||||||||||
|
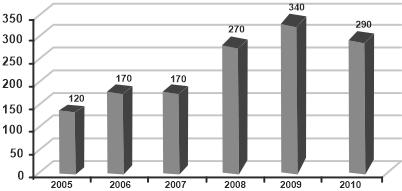
The graph shows the record of the number of admissions to a certain coaching centre from 2005 to 2010.
In how many years was the number of admission grater than that of the previous years? pipeline-1146058
|
up_police | — | intermediate | ||||||||||||||||||||||
|
The average sales of branches A, B and C in 2022 is what percent of the average sales of branches A, C and F in 2021? pipeline-1131731
|
up_police | percentage | intermediate | ||||||||||||||||||||||
|
What is the difference between half of the total sale of brand X T-Shirt and the total sale of brand Z T-Shirt? pipeline-1135249
|
up_police | — | intermediate | ||||||||||||||||||||||
|
In how many of the given years was the production of type B cars more than the average production of this type of car in the given years? pipeline-1131712
|
up_police | — | intermediate | ||||||||||||||||||||||
|
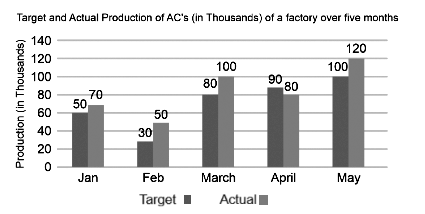
Study the given graph which shows the target and actual production of ACs (in thousands) of a factory over five months and answer the question that follows. Target and Actual Production of ACs (in Thousands) of a factory over five months.
pipeline-1131721
|
up_police | percentage | intermediate | ||||||||||||||||||||||
|
What is the approximate percentage increase in the number of the eraser boxes sold from 2018 to 2020? pipeline-1116079
|
up_police | percentage | intermediate | ||||||||||||||||||||||
|
The following bar graph shows the rainfall over two years. Which of the following months shows the highest percentage change in rainfall?
pipeline-1115450
|
up_police | — | intermediate | ||||||||||||||||||||||
|
The following bar graph represents the demand and production for five companies, V, W, X, Y and Z.On the basis of the bar graph, answer the question. Demand Production
If K% of the production for company X equals the demand for company W, then K equals: pipeline-1115459
|
up_police | — | intermediate | ||||||||||||||||||||||
|
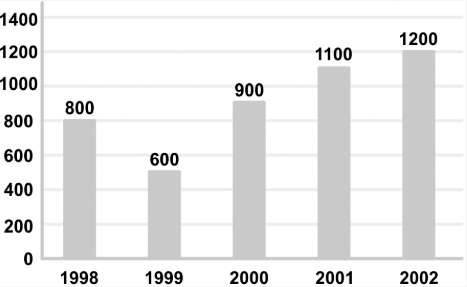
Study the given bar-graph and answer the question that follows. The bar-graph displays the number of bicycles produced at a factory from 1998 to 2002.
What was the average number of bicycles produced at the factory per year from 1998-2002? pipeline-1114978
|
up_police | — | intermediate | ||||||||||||||||||||||
|
The table below shows the number of trees planted by the government in 4 different years.
Find the ratio between the number of neem trees planted in the year 2021 and the number of birch trees planted in the year 2022. pipeline-1114982
|
up_police | — | intermediate | ||||||||||||||||||||||
|
What is the average of Plastic toys sold on Tuesday, Wednesday and Friday? pipeline-726747
|
rpf | — | intermediate | ||||||||||||||||||||||
|
Sales of iPhone 7 increases by 10% next year and equal 4950 units. Find the total sale of iPhones in 2018. pipeline-713983
|
rpf | — | intermediate | ||||||||||||||||||||||
|
Find the ratio of total number of Birthday, Farewell and Success parties held in restaurants P and Q in the month. pipeline-563728
|
rpf | — | intermediate | ||||||||||||||||||||||
|
What is the average of the sales done by Company B during those years when the sale of the company was at least Rs 40000 more than Company A in that particular year? (in Rs.) pipeline-503945
|
rpf | — | intermediate | ||||||||||||||||||||||
|
Find the ratio of urban fans of singers A and B together to total fans of singer E. pipeline-539649
|
rpf | — | intermediate | ||||||||||||||||||||||
|
What is the difference in the ratio of sales of Company B and Company A in the year 2023 and Company B and Company A in the year 2021? pipeline-703631
|
rpf | — | intermediate | ||||||||||||||||||||||
|
A new company C has a yearly sale that is equal to the sum of average sales of company A and the average sales of company B in the years 2020 to 2024. What is the sale (in lakh rupees) done by the company C? pipeline-1036052
|
rpf | — | intermediate | ||||||||||||||||||||||
|
Find the difference between the total number of parties organized in the month in both restaurants. pipeline-481591
|
rpf | — | intermediate | ||||||||||||||||||||||
|
Find the ratio of total number of Birthday, Farewell and Success parties held in restaurants P and Q in the month. pipeline-693693
|
rpf | — | intermediate | ||||||||||||||||||||||
|
What is the average of Plastic toys sold on Tuesday, Wednesday and Friday? pipeline-646003
|
rpf | — | intermediate | ||||||||||||||||||||||
|
What is the difference between the highest and the lowest production (in tons)? pipeline-590917
|
rpf | — | intermediate | ||||||||||||||||||||||
|
What is the average production of wheat in all five states? pipeline-563846
|
rpf | — | intermediate | ||||||||||||||||||||||
|
How many companies will produce more quantity of wheat than the quantity produced by B & C together? pipeline-590908
|
rpf | — | intermediate | ||||||||||||||||||||||
|
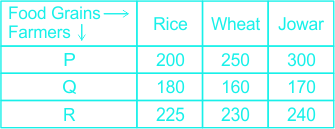
The following table shows the quantity (in kg) produced by 3 farmers.
What is the difference between the quantity of Jowar produced by all farmers and wheat produced by all farmers? pipeline-496703
|
rpf | — | intermediate | ||||||||||||||||||||||
|
How many copies of the most famous novels are sold? pipeline-503305
|
rpf | — | intermediate | ||||||||||||||||||||||
|
Find the average of the sum of the magazines A, D and E. pipeline-492596
|
rpf | — | intermediate | ||||||||||||||||||||||
|
The following table shows the quantity (in kg) produced by 3 farmers.
Which farmer produced the highest total quantity of food grain? pipeline-496696
|
rpf | — | intermediate | ||||||||||||||||||||||
|
The number of fire extinguishers sold by company X in 2022 was what percentage of the number of fire extinguishers sold by the 2 companies combined in 2022? pipeline-1289242
|
banking | percentage | intermediate | ||||||||||||||||||||||
|
What was the average number of fire extinguishers sold by company Y in 2021 and 2022? pipeline-1289240
|
banking | — | intermediate | ||||||||||||||||||||||
|
The ratio of total number of mobiles in C and D together to total number of earphones in B and D together is? pipeline-484277
|
rpf | — | intermediate | ||||||||||||||||||||||
|
The average number of scooters produced by company D is what percent (rounded off to 2 decimal places) more than the combined average number of scooters produced by the three companies A, B, and C? pipeline-481719
|
rpf | percentage | intermediate | ||||||||||||||||||||||
|
Find the number of cinema halls which sold tickets more than the average number of tickets sold by all of them. pipeline-481718
|
rpf | — | intermediate | ||||||||||||||||||||||
|
What was the ratio of the number of fire extinguishers sold by company X in 2019 and 2021 combined to the number of fire extinguishers sold by company Y in 2020? pipeline-1289241
|
banking | — | intermediate | ||||||||||||||||||||||
|
What was the average of number of fire extinguishers sold by each company in the given 4 years combined? pipeline-1289243
|
banking | — | intermediate | ||||||||||||||||||||||
|
The company which sells the least number of Microwaves is X times the company which sells the highest number of earphones. Find the value of X. pipeline-484278
|
rpf | — | intermediate | ||||||||||||||||||||||
|
What was the difference between the total number of fire extinguishers sold by company X in 2019 and 2020 combined and the total number of fire extinguishers sold by company X in 2021 and 2022 combined? pipeline-1289239
|
banking | — | intermediate | ||||||||||||||||||||||
|
Find the average number of copies of The Hindu sold in the given days. pipeline-1287354
|
banking | — | intermediate | ||||||||||||||||||||||
|
Find the difference between numbers of copies sold of The Hindu on Friday and number of copies sold of Times of India on Wednesday. pipeline-1287358
|
banking | — | intermediate | ||||||||||||||||||||||