Cluster · Data Interpretation and Graph Analysis
| Question | Category | Subtype | Difficulty | |||||||||||||||||||||||||||||||||||||
|---|---|---|---|---|---|---|---|---|---|---|---|---|---|---|---|---|---|---|---|---|---|---|---|---|---|---|---|---|---|---|---|---|---|---|---|---|---|---|---|---|
|
Total production of both companies in all 5 years is? pipeline-3310
|
reasoning | — | intermediate | |||||||||||||||||||||||||||||||||||||
|
Production of A in 2023 is equal to 80% of the sum of production of A and B in 2024, while that of B in 2023 is 60% of the sum of production in 2021. The sum of production of A and B in 2023 is? pipeline-3309
|
reasoning | — | intermediate | |||||||||||||||||||||||||||||||||||||
|
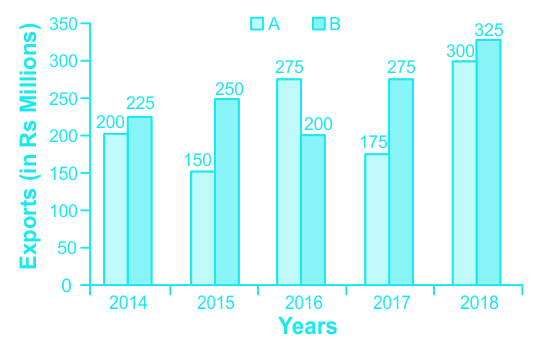
The bar graph shows the exports of cars of type A and B (in Rsmillions).
The total export of cars of type A in 2014 to 2017 is approximately what percentage less than the total exports of cars of type B in 2015 to 2018? pipeline-17844
|
reasoning | percentage | intermediate | |||||||||||||||||||||||||||||||||||||
|
The difference in average production of A and B over the years is? pipeline-3307
|
reasoning | — | intermediate | |||||||||||||||||||||||||||||||||||||
|
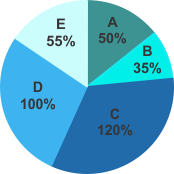
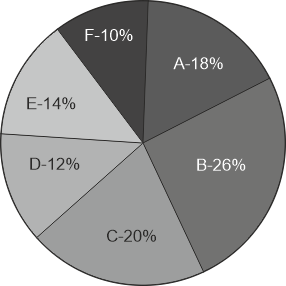
The given pie chart shows the quantity wise sales distribution of five products (A, B, C, Dand E) of a company 2016.
If 320 units of product A were sold by the company, then how many units of product B and E together were sold by the company ? pipeline-19103
|
reasoning | — | intermediate | |||||||||||||||||||||||||||||||||||||
|
The average production of type C cars during 2012 to 2016 is approximately what percent less than the total production of type D cars in 2012 and type E cars in 2014? pipeline-3003
|
reasoning | percentage | intermediate | |||||||||||||||||||||||||||||||||||||
|
The average of the total pineapples sold on all days is what percent less than apples sold on Wednesday? pipeline-2590
|
reasoning | percentage | intermediate | |||||||||||||||||||||||||||||||||||||
|
How many copies of the most famous novels are sold? pipeline-1448
|
reasoning | — | intermediate | |||||||||||||||||||||||||||||||||||||
|
The total production of type B cars in 2018, 2020, and 2021 taken together is approximately what percent more than the total production of type A cars in 2019 and 2022 taken together? pipeline-1984
|
reasoning | percentage | intermediate | |||||||||||||||||||||||||||||||||||||
|
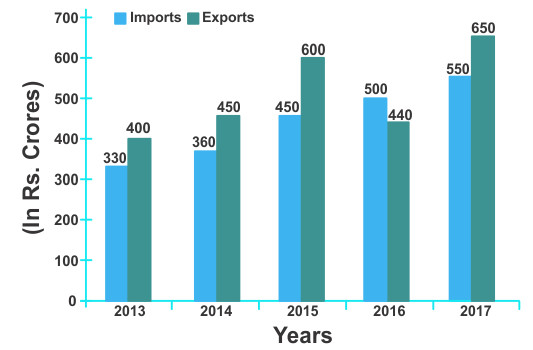
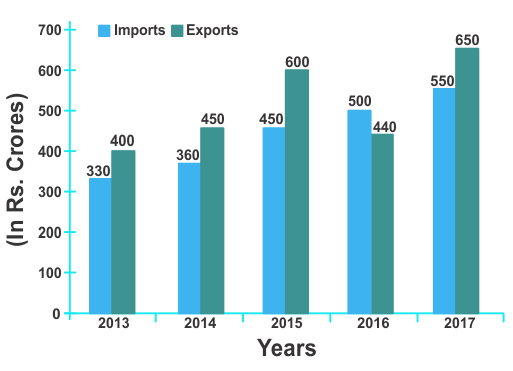
The given bar graph shows the imports and exports (in crores) of steel by a country from 2013 to 2017.
What is the ratio of the total imports in 2015 and 2017 to the total exports in 2013 and 2016 ? pipeline-18095
|
reasoning | — | intermediate | |||||||||||||||||||||||||||||||||||||
|
The number of novels which is highest selling novel in store A is what percent of the number of novels which is highest selling novel in store C? pipeline-1447
|
reasoning | percentage | intermediate | |||||||||||||||||||||||||||||||||||||
|
Number of Fridges sold by A is what percent of the number of Microwave sold by E? pipeline-3694
|
reasoning | percentage | intermediate | |||||||||||||||||||||||||||||||||||||
|
The given bar graph shows the imports and exports (in crores) of steel by a country from 2013 to 2017.
The total imports of steel in 2014, 2016 and 2017 is what percent less than the total exports in 2013, 2015 and 2017 ? (correct to one decimal place) pipeline-19117
|
reasoning | percentage | intermediate | |||||||||||||||||||||||||||||||||||||
|
The given pie chart shows the quantity wise sales distribution of 5 products (A, B, C, D and E) of a company in 2016. Quantity wise sales distribution of five products (A, B, C, D and E)
If 1500 units of product D were sold in 2016 and the total number of units sold by the company in 2017 was 18% more than that sold in 2016, then the total units sold by the company in 2017 is ? pipeline-18092
|
reasoning | — | intermediate | |||||||||||||||||||||||||||||||||||||
|
Production of company A in 2022 and 2023 combined is what percentage of production of B in 2021 and 2024? pipeline-3308
|
reasoning | percentage | intermediate | |||||||||||||||||||||||||||||||||||||
|
What is the ratio of the total production of cars of type A in 2020 and type C in 2019 taken together to the total production of cars of type B in 2022 and type E in 2021 taken together? pipeline-1971
|
reasoning | — | intermediate | |||||||||||||||||||||||||||||||||||||
|
The table shows the production of different types of cars (in thousands).
If the data related to the production of cars of type E is represented by a pie chart, then the central angle of the sector representing the data of production of cars in 2019 will be: pipeline-2000
|
reasoning | — | intermediate | |||||||||||||||||||||||||||||||||||||
|
What difference between the average of mobile sold by all companies and the average of appliances sold by D is? pipeline-3696
|
reasoning | — | intermediate | |||||||||||||||||||||||||||||||||||||
|
Find the ratio of number of copies of Alchemist sold in C and D combined to the number of copies of Da Vinci code sold in C and D combined. pipeline-1449
|
reasoning | — | intermediate | |||||||||||||||||||||||||||||||||||||
|
What is the ratio of the total number of type A and C vehicles exported in 2014 to the total number of type B and E vehicles exported in 2015? pipeline-2440
|
reasoning | — | intermediate | |||||||||||||||||||||||||||||||||||||
|
Find the total number of fruits sold on all days combined. pipeline-2593
|
reasoning | — | intermediate | |||||||||||||||||||||||||||||||||||||
|
The ratio of the total production of type A cars in 2014 and 2016 and type C cars in 2013 taken together to the total production of type B cars and type D cars taken together in 2014 is: pipeline-3008
|
reasoning | — | intermediate | |||||||||||||||||||||||||||||||||||||
|
How much percentage of sales decreased for Brand X T-shirt in 2009 compared with 2007?
pipeline-1353635
|
rajasthan | percentage | intermediate | |||||||||||||||||||||||||||||||||||||
|
In how many years, the import is more than the export of Company B? pipeline-1353617
|
rajasthan | — | intermediate | |||||||||||||||||||||||||||||||||||||
|
In which month, did the company produce an equal number of all types of scooters? pipeline-1366454
|
up_police | — | intermediate | |||||||||||||||||||||||||||||||||||||
|
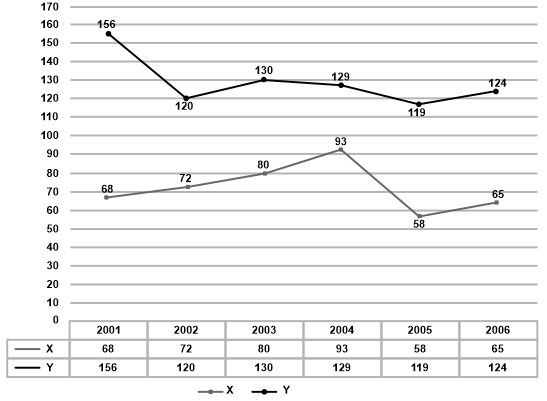
Instructions: The difference between production of Company X and Company Y was the lowest in which year?
pipeline-1362564
|
up_police | — | intermediate | |||||||||||||||||||||||||||||||||||||
|
In how many years, the import is more than the export of Company B? pipeline-1362570
|
up_police | — | intermediate | |||||||||||||||||||||||||||||||||||||
|
Find the average of the total number of tickets (Local + Foreigner) sold in 5 months. pipeline-1362571
|
up_police | — | intermediate | |||||||||||||||||||||||||||||||||||||
|
The following table gives the sales of an electronic chip over 5 years. Find the year in which the sales are equal to the average of the sales over the 5 years.
pipeline-1359934
|
up_police | — | intermediate | |||||||||||||||||||||||||||||||||||||
|
Study the following table carefully and answer the questions based on it. The following table shows the domestic sales of vehicles of four manufacturers from 2019 to 2024.
With respect to which of the following combinations, is the sales of vehicles lowest over the given period? pipeline-1369151
|
up_police | — | intermediate | |||||||||||||||||||||||||||||||||||||
|
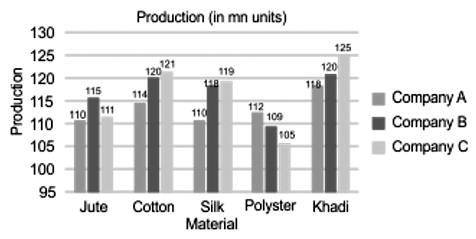
What is the difference between the total production of Cotton and Khadi? Note: Ignore negative signs, if any.
pipeline-1357877
|
up_police | — | intermediate | |||||||||||||||||||||||||||||||||||||
|
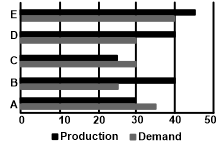
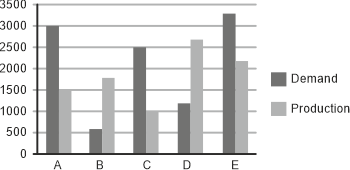
The following bar graph indicates the demand and production (in hundreds) of 5 companies A, B, C, D and E. X-axis indicates the demand and production (in hundreds) and Y-axis indicates the companies. Study the bar graph carefully and answer the question that follows
Find the difference between the average demand and average production of the five companies taken together. pipeline-1362572
|
up_police | — | intermediate | |||||||||||||||||||||||||||||||||||||
|
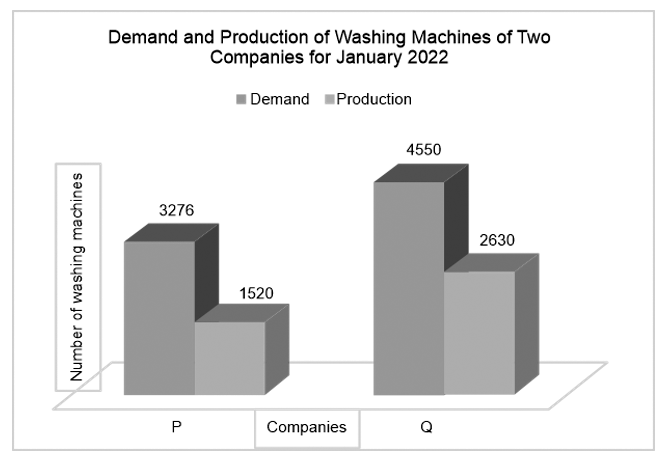
Study the given bar graph carefully and answer the following question. The demand of Company P is what percentage of the demand of Company Q?
pipeline-1350753
|
up_police | percentage | intermediate | |||||||||||||||||||||||||||||||||||||
|
120 marriages that were to be held in city C in the month of June were rescheduled to city A in the month of July. Find the total number of marriages organized in city A in all 3 months. pipeline-1350744
|
up_police | — | intermediate | |||||||||||||||||||||||||||||||||||||
|
Number of marriages organized in 3 months in city C is how much less than the number of marriages organized in July month in all 4 cities? pipeline-1350747
|
up_police | — | intermediate | |||||||||||||||||||||||||||||||||||||
|
Find the ratio of the number of persons getting married in the month of June in cities A and D and the number of persons getting married in May and July in city B. pipeline-1350748
|
up_police | — | intermediate | |||||||||||||||||||||||||||||||||||||
|
In which year was the production of scooters in all factories equal to the yearly average number of scooters produced from 2021 to 2024? pipeline-1347281
|
up_police | — | intermediate | |||||||||||||||||||||||||||||||||||||
|
If the cost of each local ticket and each foreigner ticket is Rs. 60 and Rs. 350 respectively, then find the difference in the amount collected in March and February. pipeline-1353030
|
up_police | — | intermediate | |||||||||||||||||||||||||||||||||||||
|
If 10% of the marriages scheduled for the month of May in city B got postponed to July then, approximately what percent of total marriages will be organized in city B in July month? pipeline-1350746
|
up_police | percentage | intermediate | |||||||||||||||||||||||||||||||||||||
|
What is the average number of persons getting married per month in these 4 cities in 3 months? pipeline-1350745
|
up_police | — | intermediate | |||||||||||||||||||||||||||||||||||||
|
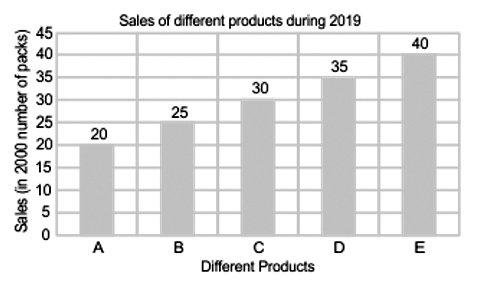
Study the given bar graph and answer the question that follows. A company provides five different products. The sales of these five products (in 1000 number of packs) during 2024 are shown in the bar-graph. Sales of different products during 2024 Sales (in 1000 number of packs)
What is the approximate ratio of sales of product A to product E in 2024? pipeline-1350750
|
up_police | — | intermediate | |||||||||||||||||||||||||||||||||||||
|
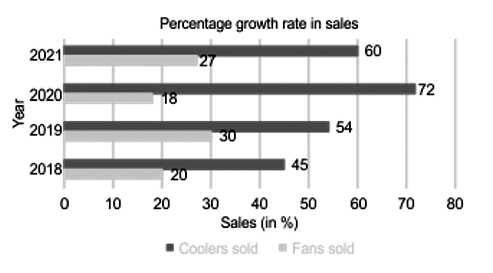
The following figure shows the percentage growth in units of fans and coolers sold in some years. What is the difference between the averages of the growth rate in coolers and fans?
pipeline-1345687
|
up_police | percentage | intermediate | |||||||||||||||||||||||||||||||||||||
|
Study the given bar-graph and answer the question that follows.
pipeline-1171802
|
up_police | percentage | intermediate | |||||||||||||||||||||||||||||||||||||
|
The number of pages printed by two printers P1 and P2 over three days are given in the following table. Study the table carefully and answer the question given below.
What is the difference between the total no of pages printed by the two printer during these three days? pipeline-1171952
|
up_police | — | intermediate | |||||||||||||||||||||||||||||||||||||
|
Find the difference in the average production of B and D during 2018-2023. pipeline-1171951
|
up_police | — | intermediate | |||||||||||||||||||||||||||||||||||||
|
The Pie chart shows the percentage distributions of total number of laptops (both Dell and HP) sold by six stores in March. Refer to the pie chart and table carefully and answer the given questions.
What is the ratio of the number of Dell laptops sold by A to that of the HP laptops sold by stores C and D together? pipeline-1171503
|
up_police | percentage | intermediate | |||||||||||||||||||||||||||||||||||||
|
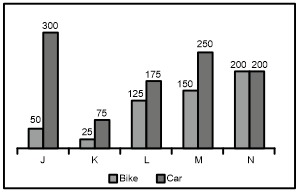
The bar graph given below shows the sales of bikes and cars of five companies J, K, L, M and N.
PI = The total sales of bikes of all the 5 companies. P2 = The total sales of cars of the all 5 companies. What is the value of (P2-P1)? pipeline-1145286
|
up_police | — | intermediate | |||||||||||||||||||||||||||||||||||||
|
What is the ratio between the number of the pages printed by printer Q in second month and the number of pages printed by printer U in the fifth month? pipeline-1148154
|
up_police | — | intermediate | |||||||||||||||||||||||||||||||||||||
|
Study the following graph carefully and answer the questions given below it.
pipeline-1139704
|
up_police | — | intermediate | |||||||||||||||||||||||||||||||||||||
|
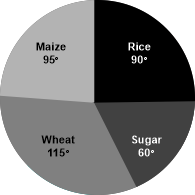
The annual agricultural production (in tonnes) of an Indian state is given in the pie chart. The total production is 12960 tonnes.
pipeline-1133464
|
up_police | — | intermediate | |||||||||||||||||||||||||||||||||||||