Cluster · Pie Chart Data Interpretation
| Question | Category | Subtype | Difficulty | |
|---|---|---|---|---|
|
Find the expenditure (in Rs.) on education. pipeline-666038
|
quant | — | intermediate | |
|
How much percent is more expense on rent than the expense on others? pipeline-577335
|
quant | percentage | intermediate | |
|
Find the central angle for the book in store S. pipeline-666041
|
quant | — | intermediate | |
|
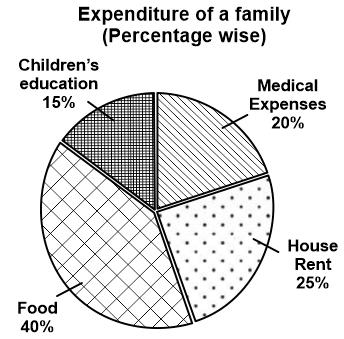
The following pie chart shows the various expenses of a family, as percentages of total expenditure of the family during a period.
If the total expenditure of the family during that period was Rs 2,00,000 then find the amount spent on medical expenses (in Rs). pipeline-348766
|
quant | — | intermediate | |
|
What is the central angle corresponding to the expenditure spent on Education? pipeline-568009
|
quant | — | intermediate | |
|
The given pie-chart represents the survey report on the favourite games of a group of young people.
If a total of 4980 people were surveyed, then what is the central angle produced by the sector indicating football? pipeline-579014
|
quant | — | intermediate | |
|
Expenditure on Fuel and Transport forms what percentage of expenditure on salary for the year 2001? pipeline-33220
|
quant | percentage | intermediate | |
|
What is the sum of the central angles made by sector P4 and sector P6? pipeline-370470
|
quant | — | intermediate | |
|
If the total amount spent on sports during the year was Rs. 75,00,000 then how much (in Rs.) was spent on cricket and hockey together? pipeline-579333
|
quant | — | intermediate | |
|
What was the difference between the average monthly income of Jyoti over all the six years taken together and Aman's monthly income in the year 2006 (in Rs)? pipeline-370469
|
quant | — | intermediate | |
|
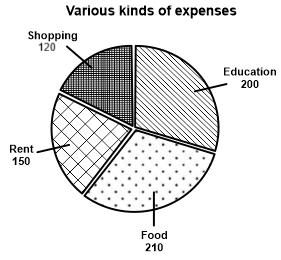
The following pie chart gives the ratio of various kinds of expenses of a particular family for a week.
If the amount spent on shopping for the week is Rs 1,000, what is the total amount spent on food (in Rs)? pipeline-356436
|
quant | — | intermediate | |
|
How much does he spend on children's fees in a year (in Rs)? pipeline-363267
|
quant | — | intermediate | |
|
If the total income of the family was Rs 1,00,000, how much money (in Rs) was spent on the education of the children? pipeline-581506
|
quant | — | intermediate | |
|
The pie-chart given here shows the spending of a country on various sports during a year. Study the graph carefully to answer these questions.
pipeline-575394
|
quant | — | intermediate | |
|
The following table shows the monthly expenses (in Rs) of three persons.
What is the total expenses of all three persons on Food (in Rs)? pipeline-348769
|
quant | — | intermediate | |
|
Study the given pie chart and answer the question that follows. The pie chart represents the percentage of magazine users in five different cities of India.
What is the central angle made by Bhopal city in the pie chart? pipeline-578297
|
quant | percentage | intermediate | |
|
Pi Chart represent the modes of transport used by different employees in a university.
The central angle of the sector for officers using two-wheelers is: pipeline-580333
|
quant | — | intermediate | |
|
The pie chart given here shows the spending by a family on various items during the year 1999. Study the graph and answer these questions.
If the total amount spent during the year 1999 was Rs 46,000, the amount spent on food was: pipeline-574640
|
quant | — | intermediate | |
|
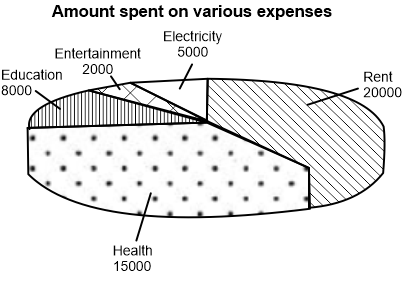
What is the central angle corresponding to the sector indicating the expenses incurred on Health?
pipeline-536128
|
quant | — | intermediate | |
|
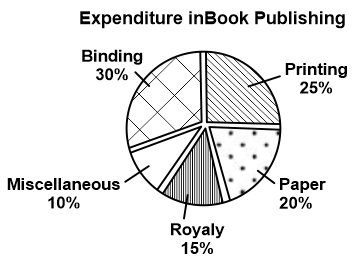
Study the given pie-chart and answer the question that follows.The pie-chart shows the expenditure incurred in the preparation of a book by a publisher, under various heads.
What is the difference between the angle of the pie chart showing the expenditure incurred on binding and printing? pipeline-537323
|
quant | — | intermediate | |
|
The pie chart shows the cost of construction of a house in degree.
What is the average expenditure on timber, super-vision, and cement? pipeline-615565
|
quant | — | intermediate | |
|
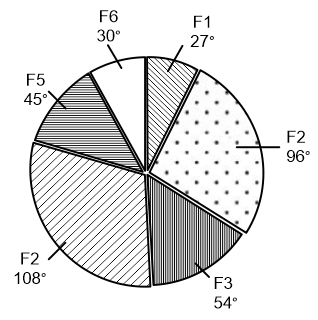
The following pie chart shows the sectors representing the shares of the number of lights manufactured in a given year by each of six different factories in terms of the central angles (in degrees) with respect to the total number of lights manufactured in that year by all the six factories taken together.
If the total number of lights manufactured in that year by the 6 factories taken together is 1840, then what is the difference between the numbers of lights manufactured by F5 and F1? pipeline-366540
|
quant | — | intermediate | |
|
Study the given pie chart carefully and answer the following question. What is the difference between the funds (in Rs.) acquired by the school from donations and those from government agencies?
pipeline-544867
|
quant | — | intermediate | |
|
Study the given pie chart carefully and answer the following question: If the scholarship has to be paid out of the donation fund, then what is the percentage of the donation fund used for this purpose (rounded off to two decimal places)? The entire fund that the school gets from different sources is equal to Rs.10 lakh
pipeline-544567
|
quant | percentage | intermediate | |
|
The following pie chart shows the different coloured dresses worn by 60 students in a college party. Study the pie chart and answer the question that follows.
The degrees (central angle) for the blue coloured dress (sector which represents 40%) is: pipeline-555427
|
quant | — | intermediate | |
|
The following pie chart shows the annual expenditure on different items. What is the minimum angle in the given pie chart?
pipeline-562351
|
quant | — | intermediate | |
|
What is the ratio of average money each person has to pay for all different types of facilities with room available when staying in single, double, and triple sharing excluding the electricity bill? pipeline-94752
|
english | — | intermediate | |
|
What is the ratio of total monthly income of B and E together and the total amount spent on Food and Miscellaneous together? pipeline-51437
|
english | — | intermediate | |
|
Each of the floor except the 5th floor paid half of their consumption as domestic charges and another half as commercial charges. 5th floor paid 75% of their consumption as domestic and rest as commercial charges. What is the total amount paid as electricity charges by the building? pipeline-40577
|
english | — | intermediate | |
|
Find the difference in the total amount spent on the materials used in the highest and second lowest proportions. pipeline-51446
|
english | — | intermediate | |
|
Find the amount spent by a person in double sharing and having 2 times meals and snacks without any use of laundry. pipeline-94750
|
english | — | intermediate | |
|
If there are 20 employees in the foreign tours then find the average spend of one employee. pipeline-94571
|
english | — | intermediate | |
|
The average spend of CEO is 278000. Find the ratio of Manager spend in New York and CEO’s minimum spend if the ratio of the CEO’s London spend and Manager’s New York spend is 90 : 31. pipeline-94568
|
english | — | intermediate | |
|
What is the total amount 3 people living together in triple sharing needs to pay at the end of the month when they have 3 times meal and no use of laundry service? pipeline-94751
|
english | — | intermediate | |
|
If 18 people each are using these 4 types on triple sharing. What will the owner get in total from all of them? pipeline-94753
|
english | — | intermediate | |
|
What is the average of Manager’s spend if he spends 200% more than HR’s Philippines spend in his London visit? pipeline-94569
|
english | — | intermediate | |
|
The amount paid by the 1st floor for electricity is what percentage of the amount paid by 3rd floor if 1st floor is used for domestic purpose and 3rd floor is used for commercial purpose? pipeline-40573
|
english | percentage | intermediate | |
|
What is the difference between the money spent on non-veg food to money spent on veg food in the whole journey? pipeline-91157
|
english | — | intermediate | |
|
The average spend of Team head is how much per cent more than the average spend of HR in all visit. pipeline-94574
|
english | — | intermediate | |
|
Out of the amount spent on Rent, E contributes 25% of his income and A contributes 20% of his income. How much amount is contributed by B, C and D for rent? pipeline-51440
|
english | — | intermediate | |
|
Total amount spent on Bricks and Stone is how much percentage of the amount spent on Iron? pipeline-51445
|
english | percentage | intermediate | |
|
The amount of monthly income of A is what percentage of the total amount spent on Rent and Electricity? pipeline-51438
|
english | percentage | intermediate | |
|
If the 1st and 4th quarters are considered as winters and the other 2 quarters as summers, what is the difference in total expenditure on all pets between winters and summers? pipeline-49040
|
english | — | intermediate | |
|
What is the difference in the expenditure between the quarter in which he spent maximum and the quarter in which he spent minimum? pipeline-49042
|
english | — | intermediate | |
|
Total expenditure on Rabbit is what percentage of total expenditure on Dog? (Approx.) pipeline-49034
|
english | percentage | intermediate | |
|
What is the average expenditure on all pets combined in 2024? pipeline-49037
|
english | — | intermediate | |
|
What is the ratio of expenditure on cat in the first quarter and third quarter to expenditure on dog in the second and fourth quarters? pipeline-49041
|
english | — | intermediate | |
|
What is the angle corresponding to the percentage of people who lack calcium in the pie chart? pipeline-49748
|
english | percentage | intermediate | |
|
Funds used in R & D is what percent more than funds used in sports and other activities? pipeline-1384
|
reasoning | percentage | intermediate | |
|
Money spent on travel is what percent of money saved? pipeline-1062
|
reasoning | percentage | intermediate |