Cluster · Data Interpretation and Graph Analysis
| Question | Category | Subtype | Difficulty | |||||||||||||||||||||||||||||||||||||||||||
|---|---|---|---|---|---|---|---|---|---|---|---|---|---|---|---|---|---|---|---|---|---|---|---|---|---|---|---|---|---|---|---|---|---|---|---|---|---|---|---|---|---|---|---|---|---|---|
|
Find the difference between the average production (in thousand tonnes) for all states in both years. pipeline-670597
|
quant | — | intermediate | |||||||||||||||||||||||||||||||||||||||||||
|
Find the ratio between the number of pen drives produced in January, March, and April. pipeline-669033
|
quant | — | intermediate | |||||||||||||||||||||||||||||||||||||||||||
|
In how many of the given years was the production of type B cars more than the average production of this type of car in the given years? pipeline-668730
|
quant | — | intermediate | |||||||||||||||||||||||||||||||||||||||||||
|
The average sales of branches A, C, and F in 2021 is what percent of the average sales of branches A, B, and C in 2022? pipeline-668716
|
quant | percentage | intermediate | |||||||||||||||||||||||||||||||||||||||||||
|
In which year was the production of scooters in all factories equal to the yearly average number of scooters produced from 1985 to 1989? pipeline-666010
|
quant | — | intermediate | |||||||||||||||||||||||||||||||||||||||||||
|
In which month, did the company produce an equal number of all types of scooters? pipeline-665976
|
quant | — | intermediate | |||||||||||||||||||||||||||||||||||||||||||
|
Find the difference between the number of mobile phones sold by store Q in 2013 and store S in 2015. pipeline-574724
|
quant | — | intermediate | |||||||||||||||||||||||||||||||||||||||||||
|
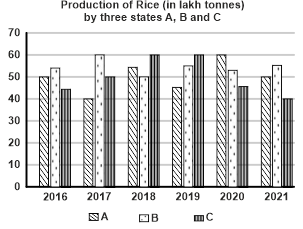
80% of the combined average production of companies B and C is what percentage (to the nearest integer) more/less than 90% of the average production of company A, for the given period of 2012 to 2017? pipeline-664909
|
quant | percentage | intermediate | |||||||||||||||||||||||||||||||||||||||||||
|
In which month was the sale of Melons the lowest and by how much was it more than the sale of Oranges in that month? pipeline-668773
|
quant | — | intermediate | |||||||||||||||||||||||||||||||||||||||||||
|
Which year shows the highest change in the revenue obtained from magazines? pipeline-670594
|
quant | — | intermediate | |||||||||||||||||||||||||||||||||||||||||||
|
The ratio of combined sales of C1 and C4 in the year 2013 in comparison to 2012 is: pipeline-17146
|
quant | — | intermediate | |||||||||||||||||||||||||||||||||||||||||||
|
Find the ratio of tourists from the country coming in during March and April. pipeline-568030
|
quant | — | intermediate | |||||||||||||||||||||||||||||||||||||||||||
|
How much percentage of sales decreased for Brand X Tshirt in 2009 compared with 2007? pipeline-561189
|
quant | percentage | intermediate | |||||||||||||||||||||||||||||||||||||||||||
|
What is the difference between half of the total sale of brand X T-Shirt and the total sale of brand Z T-Shirt? pipeline-570254
|
quant | — | intermediate | |||||||||||||||||||||||||||||||||||||||||||
|
How much percentage of sales decreased for Brand X T-shirt in 2009 compared with 2007? pipeline-570309
|
quant | percentage | intermediate | |||||||||||||||||||||||||||||||||||||||||||
|
In how many years, the import is more than the export of Company B? pipeline-570301
|
quant | — | intermediate | |||||||||||||||||||||||||||||||||||||||||||
|
The average sales of an electronics shop in the years 2001, 2002, 2003, and 2004 is Rs.1850, and that for the years 2002, 2003, 2004, and 2005 is Rs.2125. If the sales in 2005 were Rs.1200, then find the sales in 2001.(in Rs.) pipeline-516458
|
quant | — | intermediate | |||||||||||||||||||||||||||||||||||||||||||
|
In how many years, the export is more than the import of Company A? pipeline-570300
|
quant | — | intermediate | |||||||||||||||||||||||||||||||||||||||||||
|
Following is the figure showing the sales of different items in a stationary shop. Which product recorded the highest percentage change from 2020 to 2021?
pipeline-581554
|
quant | — | intermediate | |||||||||||||||||||||||||||||||||||||||||||
|
What is the average number of books sold by City C in July, September and October together? pipeline-31689
|
quant | — | intermediate | |||||||||||||||||||||||||||||||||||||||||||
|
The table below shows the production of jute fabric (in lakh metre) by two Companies P and Q during 2001 to 2005.
In which year/years, did Company Q produce more fabric than Company P? pipeline-574729
|
quant | — | intermediate | |||||||||||||||||||||||||||||||||||||||||||
|
The following table gives the number of different types of batteries sold by a company over the years (numbers in hundreds).
What is the difference in the number of 7AH batteries sold in 2021 and 2022?
pipeline-578432
|
quant | — | intermediate | |||||||||||||||||||||||||||||||||||||||||||
|
If 30% of the total number of books sold by City B, D and E together in July were academic books, how many non-academic books were sold by the cities together in the same month? pipeline-31687
|
quant | — | intermediate | |||||||||||||||||||||||||||||||||||||||||||
|
What is the respective ratio between the total number of books sold by City A in July and September together and the total number of books sold by City E in August and October together? pipeline-31688
|
quant | — | intermediate | |||||||||||||||||||||||||||||||||||||||||||
|
In which year was there maximum percentage increase in the export of apples to that of the previous years? pipeline-568017
|
quant | percentage | intermediate | |||||||||||||||||||||||||||||||||||||||||||
|
What percent of the total T-shirts sold by brand Y were T-shirts of brand Z in 2009? (correct to two decimal places) pipeline-570276
|
quant | percentage | intermediate | |||||||||||||||||||||||||||||||||||||||||||
|
Bar Graph showing the number of cars sold by a reputed company during different months of the year. Look at the following bar graph and answer the question that follows:
In which month was the sale highest and was what percent of the total sale of 6 months? pipeline-606837
|
quant | percentage | intermediate | |||||||||||||||||||||||||||||||||||||||||||
|
The data of production (in million) of three types of medicines by three different companies is given below.
Which is the following gives the minimum production of a medicine by any company? pipeline-581577
|
quant | — | intermediate | |||||||||||||||||||||||||||||||||||||||||||
|
The ratio of the quantities imported of steel and iron in 2018 was 3 : 2 and in 2020 it was 1 : 1. The ratio of the quantities imported of steel in 2018 and 2020 was 4 : 3. What was the ratio of the quantities imported of iron in 2018 and 2020? pipeline-360990
|
quant | — | intermediate | |||||||||||||||||||||||||||||||||||||||||||
|
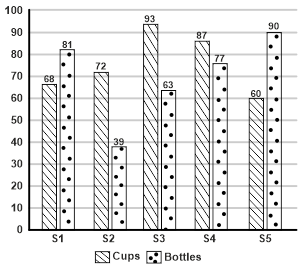
Study the given bar graph and answer the question that follows. The bar graph shows the number of bottles and the number of cups sold by five different shops during a given week.
The total number of bottles sold during the given week by the five shops taken together is approximately what percentage of the total number of cups sold during the given week by the five shops taken together? pipeline-349278
|
quant | percentage | intermediate | |||||||||||||||||||||||||||||||||||||||||||
|
The following bar graph indicates the sales of various items in a shop for one day. Study the bar graph carefully and answer the question that follows
Find the ratio between the sale of wheat and rice and also the ratio between the sale of sugar and onions, respectively. pipeline-571050
|
quant | — | intermediate | |||||||||||||||||||||||||||||||||||||||||||
|
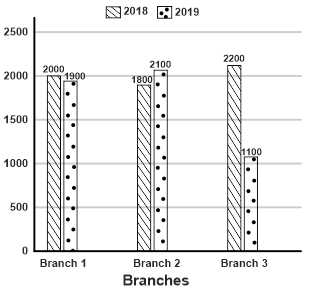
The following bar graph shows the sales of two-wheelers from three different company branches during two consecutive years 2018 and 2019.
What is the average sale of all the branches in the year 2019? pipeline-355911
|
quant | — | intermediate | |||||||||||||||||||||||||||||||||||||||||||
|
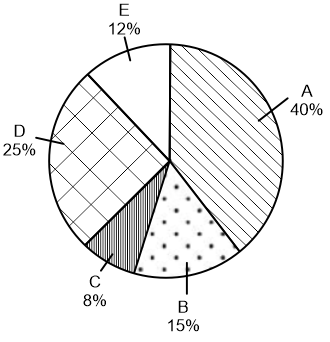
The following pie chart shows the monthly sales of laptops by five companies (A, B, C, D, and E) in a store.
If 2,500 laptops were sold by the store in a month, then what is the difference between the number of laptops sold by Company A and that of Company C? pipeline-537077
|
quant | — | intermediate | |||||||||||||||||||||||||||||||||||||||||||
|
Study the following bar chart and answer the question.
Find the percentage increase of sales of XYZ phones from 2019 to 2020? (Rounded up to 2 decimal places) pipeline-541027
|
quant | percentage | intermediate | |||||||||||||||||||||||||||||||||||||||||||
|
The number of sport bicycles sold by a shopkeeper in five years is shown in the following bar graph.
What is the percentage of decrease in the sale of sport bicycles in the year 2021 over that in the previous year? pipeline-539631
|
quant | percentage | intermediate | |||||||||||||||||||||||||||||||||||||||||||
|
Select the correct statement with respect to the below bar graph.
pipeline-534807
|
quant | — | intermediate | |||||||||||||||||||||||||||||||||||||||||||
|
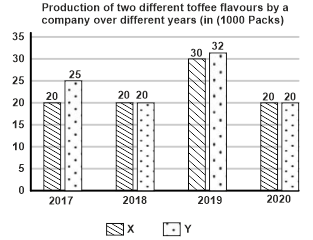
A toffee company prepares toffee of two different flavours X and Y. The production of two flavours over a period of 4 years is expressed in the bar graph given below.
What is the difference between the average production of flavour X in 2017 and 2018 and the average production of flavour Y in 2019 and 2020. pipeline-541401
|
quant | — | intermediate | |||||||||||||||||||||||||||||||||||||||||||
|
Industrial growth of different countries (in crores of 2): How many countries' industrial growth is more than the average industrial growth? pipeline-534799
|
quant | — | intermediate | |||||||||||||||||||||||||||||||||||||||||||
|
How many cars assembled by machine C were accepted? pipeline-607689
|
quant | — | intermediate | |||||||||||||||||||||||||||||||||||||||||||
|
Study the given bar-graph and answer the question that follows.
What is the average sales of all the companies (in 1000 numbers) for the year 2018? pipeline-539199
|
quant | — | intermediate | |||||||||||||||||||||||||||||||||||||||||||
|
The following table shows the number of sweets manufactured by six factories.
What is the respective ratio of sweets manufactured by factories P, Q and R together in the year 1998, to the sweets manufactured by factories S, T and U together in the same year? pipeline-539209
|
quant | — | intermediate | |||||||||||||||||||||||||||||||||||||||||||
|
The following bar graph represents the demand and production for five companies, V, W, X, Y and Z.On the basis of the bar graph, answer the question. Demand Production
If K% of the production for company X equals the demand for company W, then K equals: pipeline-556055
|
quant | — | intermediate | |||||||||||||||||||||||||||||||||||||||||||
|
The following bar graph shows the rainfall over two years. Which of the following months shows the highest percentage change in rainfall?
pipeline-556419
|
quant | — | intermediate | |||||||||||||||||||||||||||||||||||||||||||
|
Study the given bar graph carefully and answer the following question. The demand of Company P is what percentage of the demand of Company Q?
pipeline-544886
|
quant | percentage | intermediate | |||||||||||||||||||||||||||||||||||||||||||
|
The following figure shows the percentage growth in units of fans and coolers sold in some years. What is the difference between the averages of the growth rate in coolers and fans?
pipeline-565644
|
quant | percentage | intermediate | |||||||||||||||||||||||||||||||||||||||||||
|
Study the given bar graph carefully and answer the following question. What is the ratio of the number of companies with more demand than production to the number of companies with more production than demand?
pipeline-550051
|
quant | — | intermediate | |||||||||||||||||||||||||||||||||||||||||||
|
The number of mobile sim-cards in 4 states/UT are given in the bar diagram. Study the diagram and answer the question.
In Delhi, the ratio of BSNL Sim-cards and Airtel Sim-cards sold is: pipeline-562359
|
quant | — | intermediate | |||||||||||||||||||||||||||||||||||||||||||
|
Study the given bar graph and answer the question that follows. A company provides five different products. The sales of these five products (in 1000 number of packs) during 2019 are shown in the bar-graph. Sales of different products during 2019 Sales (in 1000 number of packs)
What is the approximate ratio of sales of product A to product E in 2019? pipeline-556051
|
quant | — | intermediate | |||||||||||||||||||||||||||||||||||||||||||
|
What is the difference between the total production of Cotton and Khadi? Note: Ignore negative signs, if any.
pipeline-565648
|
quant | — | intermediate | |||||||||||||||||||||||||||||||||||||||||||
|
Samantha has been tracking her daily tablet consumption over the past week. Find the average number of tablets Samantha consumed per day over the week. Here's a summary of the number of tablets she took each day: Monday = 3 tablets, Tuesday = 5 tablets, Wednesday = 4 tablets, Thursday = 7 tablets, Friday = 6 tablets, Saturday = 8 tablets, and Sunday = 2 tablets pipeline-504486
|
english | — | intermediate | |||||||||||||||||||||||||||||||||||||||||||